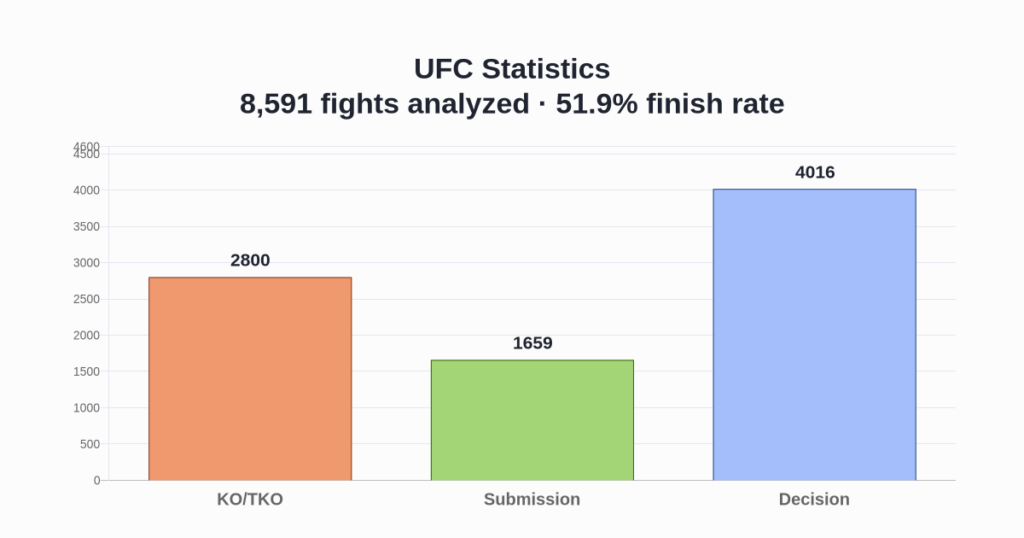
GrapplerHQ analyzed 8,591 UFC fights from March 11, 1994 through March 28, 2026. Of those bouts, 51.9% ended by KO/TKO or submission, while 46.8% reached a decision.
Key findings
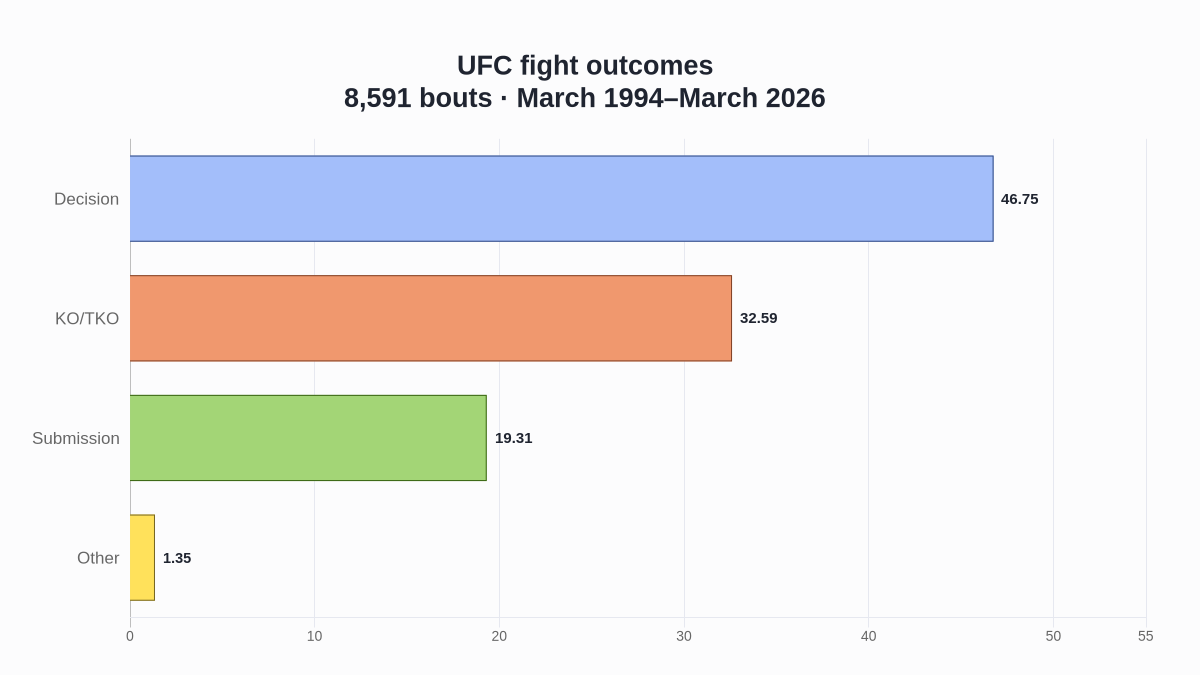
- KO/TKO accounted for 2,800 fights (32.6%), submissions for 1,659 (19.3%), and decisions for 4,016 (46.8%).
- The average UFC fight lasted 10:37; the median was 13:48.
- Heavyweight had the highest finish rate among divisions with at least 100 bouts: 66.1% across 765 fights.
- Official title bouts finished 57.4% of the time overall, but only 46.7% finished inside 15 minutes—lower than the 51.1% rate for non-title bouts in the same window.
- Annual finish rates from 2015 through 2025 ranged from 44.5% to 52.6%, not a steady rise or decline.
This is a living UFC statistics study built from bout-level data. It is designed to answer the broad question first, then show where the simple headline needs context. The source snapshot is current through March 28, 2026; later events are not included yet.
What do the UFC statistics show?
| Measure | Result |
|---|---|
| Fights analyzed | 8,591 |
| Date range | March 11, 1994–March 28, 2026 |
| Finishes | 4,459 (51.9%) |
| Decisions | 4,016 (46.8%) |
| Average fight length | 10:37 |
| Median fight length | 13:48 |
| First-round finishes | 2,349 (27.3% of all fights) |
The most useful top-line answer is that UFC fights finish slightly more often than they go to a decision. A finish means KO/TKO, doctor stoppage, or submission. The remaining 1.4% consists of overturned results, disqualifications, “could not continue” outcomes, and other uncommon result types.
Free every Tuesday
The Grappler Brief
The week’s biggest stories from BJJ, judo, wrestling, and submission grappling—curated for people who train.
Sent out weekly.Opt out anytime.
That broad split hides major differences by era, division, and scheduled bout length. Treating every UFC fight as interchangeable would produce a neat number, but not a very honest explanation.
How often do UFC fights end by knockout, submission or decision?
| Outcome | Fights | Share |
|---|---|---|
| KO/TKO | 2,800 | 32.6% |
| Submission | 1,659 | 19.3% |
| Decision | 4,016 | 46.8% |
| Other | 116 | 1.4% |
Decision is the largest single category at 46.8%. However, KO/TKO and submission combine for 51.9%, so a randomly selected fight from the complete dataset was slightly more likely to finish than to reach the scorecards.
Knockouts and technical knockouts were more common than submissions: 2,800 versus 1,659. Doctor stoppages are included with KO/TKO because the fight was stopped before the scheduled time; this study does not treat them as judges’ decisions.
Among all 4,016 decisions, 3,098 were unanimous, 818 were split and 100 were majority decisions. Split decisions therefore account for 20.4% of decisions and 9.5% of the full dataset. That figure measures the recorded decision type, not whether the public or media agreed with the judges.
What are the most common submissions in the UFC?
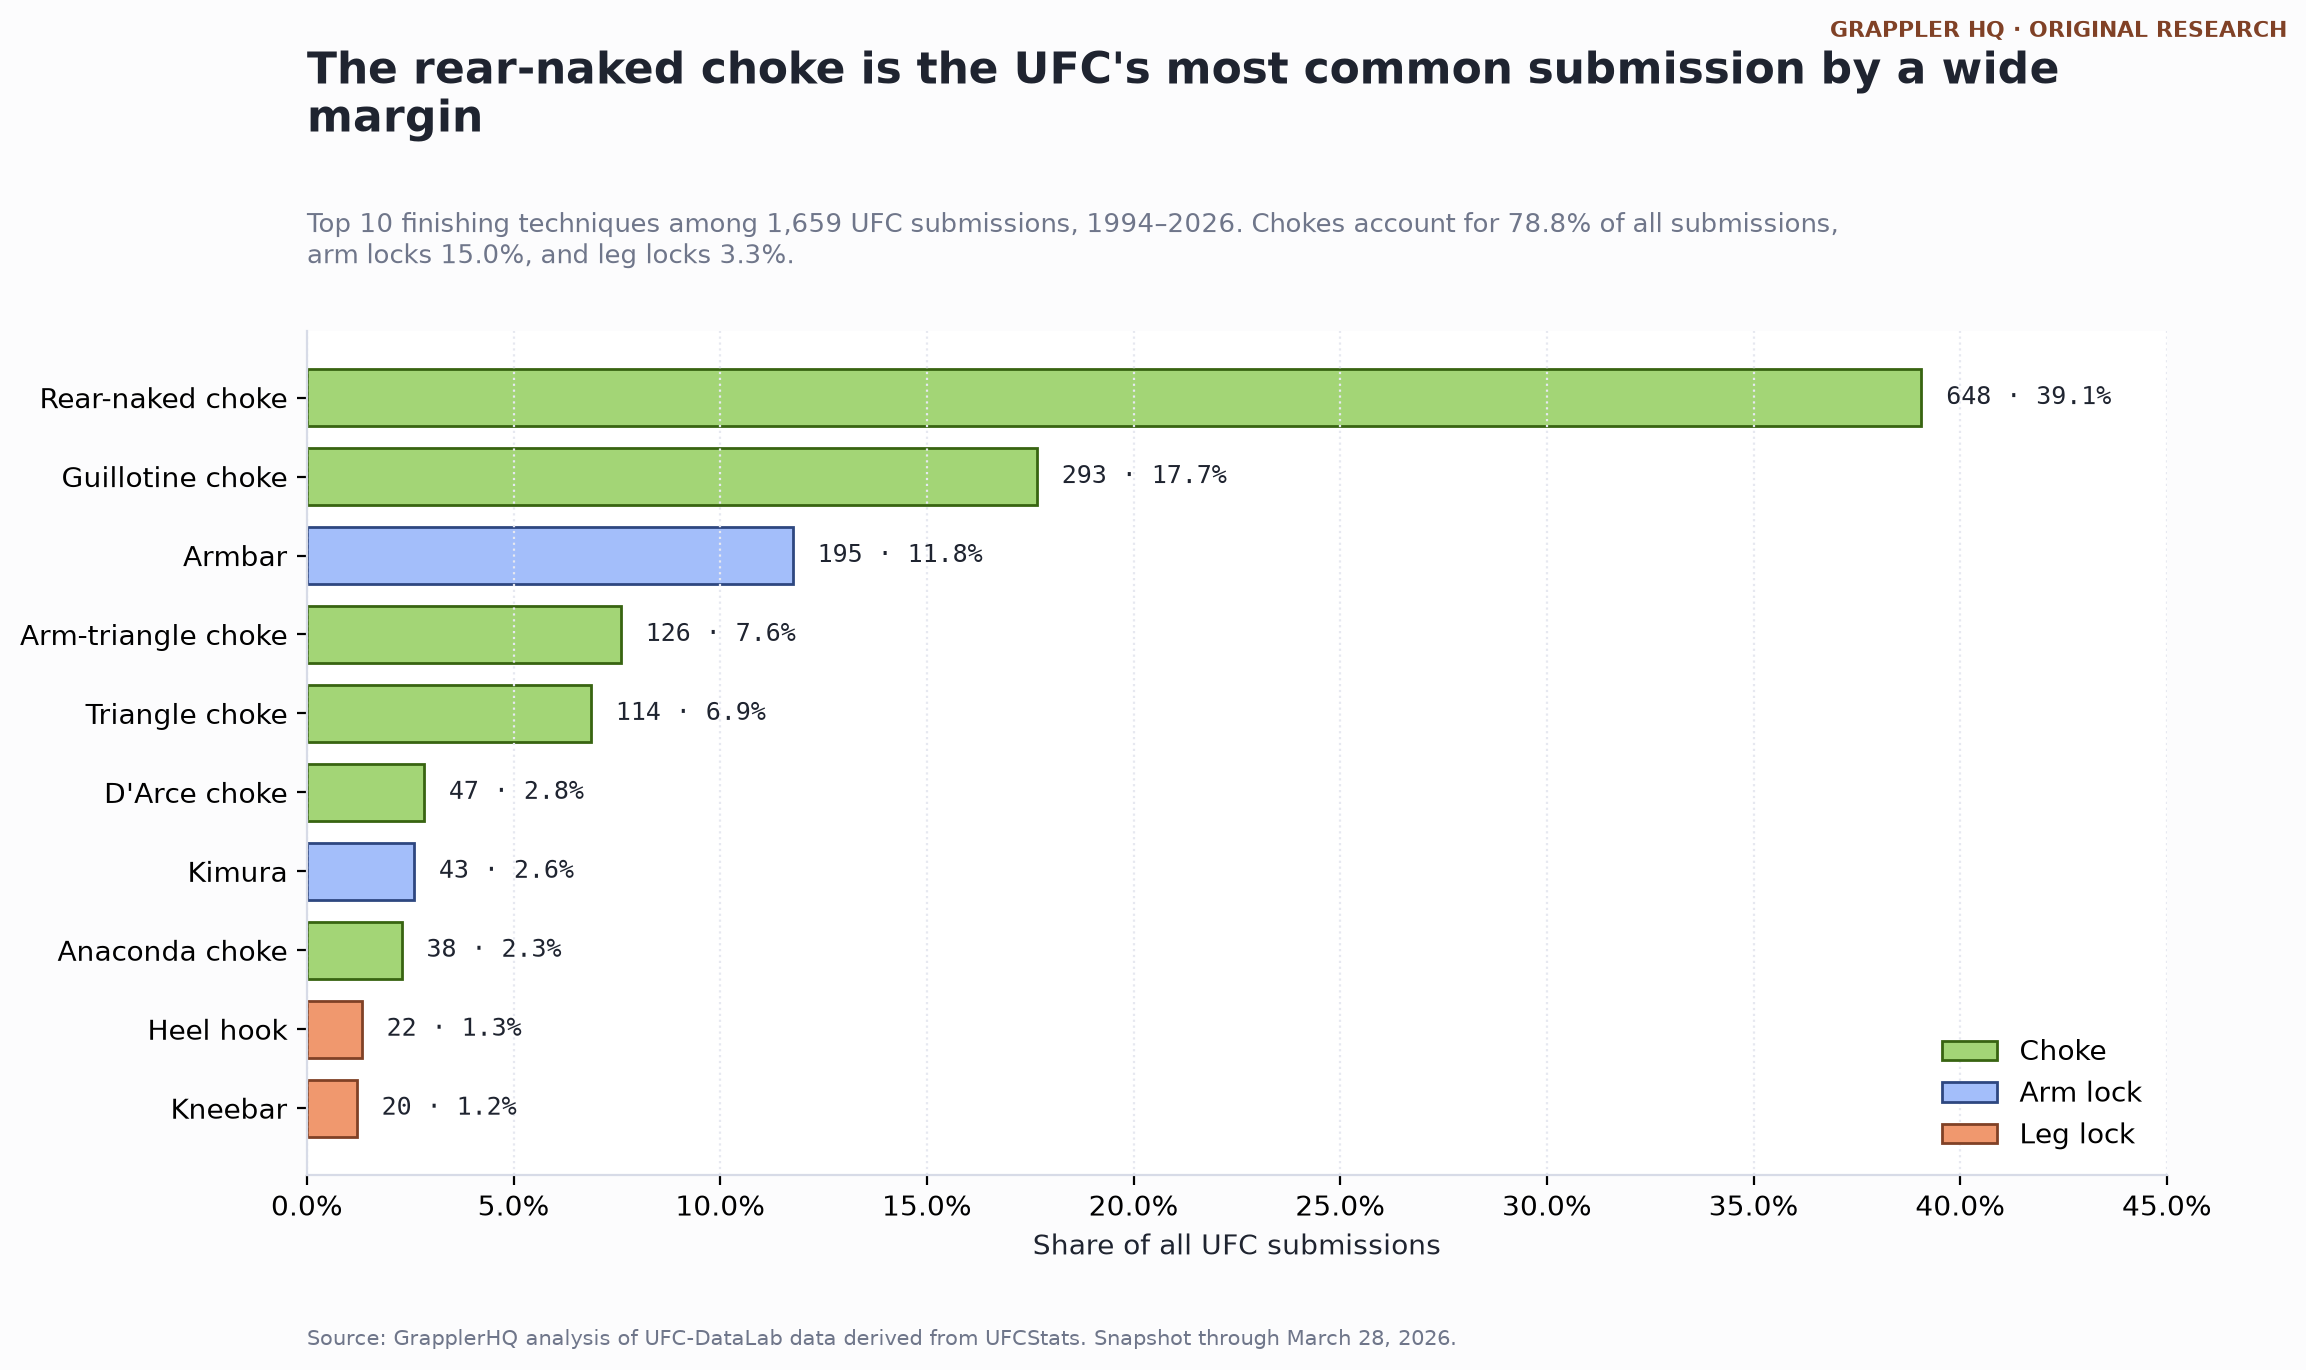
Of the 8,591 UFC fights in this dataset, 1,659 (19.3%) ended in a submission. The rear-naked choke is the most common submission in UFC history by a wide margin, finishing 648 bouts — 39.1% of all submissions, more than the next two techniques combined. Chokes as a group account for 78.8% of UFC submissions; arm-based joint locks 15.0%; leg locks just 3.3%.
| Submission | Fights | Share of submissions |
|---|---|---|
| Rear-naked choke | 648 | 39.1% |
| Guillotine choke | 293 | 17.7% |
| Armbar | 195 | 11.8% |
| Arm-triangle choke | 126 | 7.6% |
| Triangle choke | 114 | 6.9% |
| D’Arce choke | 47 | 2.8% |
| Kimura | 43 | 2.6% |
| Anaconda choke | 38 | 2.3% |
| All other techniques | 155 | 9.3% |
Three of the four most common finishes are chokes, and the top eight techniques cover more than 90% of all submissions. Leg locks account for just 3.3% of UFC submissions across the full history — a striking gap given how prominent they have become in modern no-gi grappling. In the UFC’s grappling-only UFC BJJ events, where there are no strikes, that balance flips entirely: leg locks are the single most common submission family.
How has the UFC finish rate changed over time?
The modern annual finish rate has fluctuated rather than moving in one direction. Across complete calendar years from 2015 through 2025, it peaked at 52.6% in 2022 and fell as low as 44.5% in 2024. It returned to exactly 50.0% in 2025.
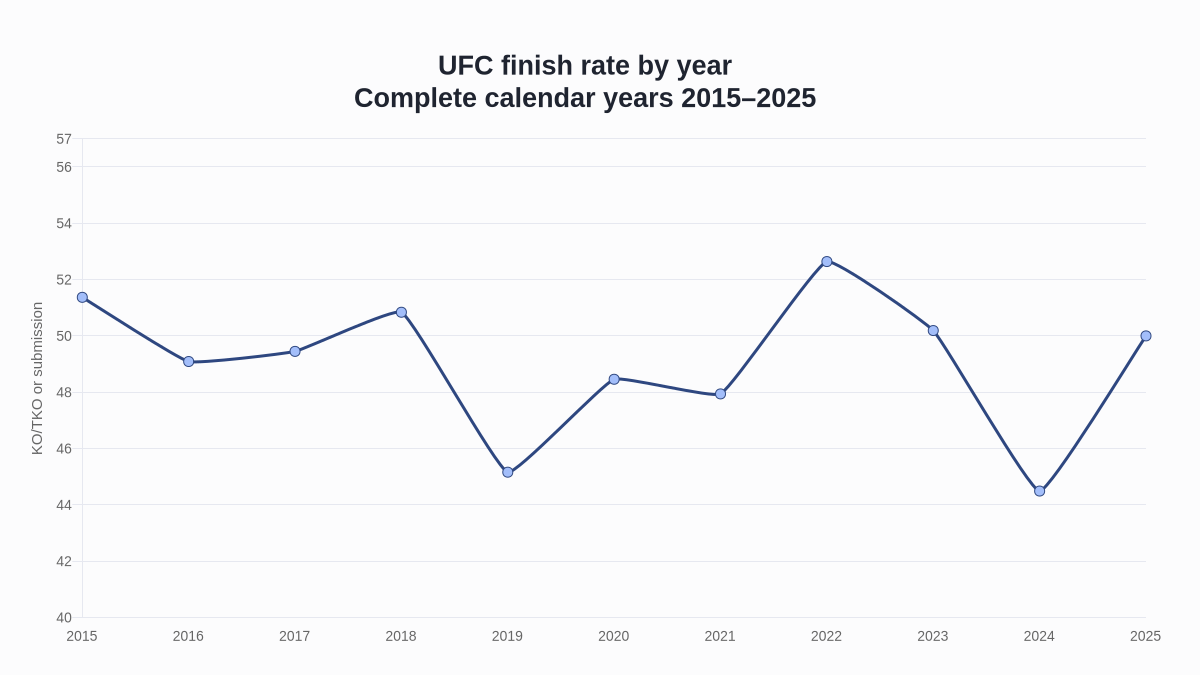
| Year | Fights | Finishes | Finish rate | KO/TKO | Submissions | Decisions |
|---|---|---|---|---|---|---|
| 2015 | 473 | 243 | 51.4% | 155 | 88 | 221 |
| 2016 | 493 | 242 | 49.1% | 153 | 89 | 248 |
| 2017 | 457 | 226 | 49.5% | 146 | 80 | 224 |
| 2018 | 474 | 241 | 50.8% | 151 | 90 | 229 |
| 2019 | 516 | 233 | 45.2% | 153 | 80 | 277 |
| 2020 | 456 | 221 | 48.5% | 139 | 82 | 226 |
| 2021 | 509 | 244 | 47.9% | 171 | 73 | 256 |
| 2022 | 511 | 269 | 52.6% | 171 | 98 | 239 |
| 2023 | 520 | 261 | 50.2% | 159 | 102 | 248 |
| 2024 | 517 | 230 | 44.5% | 147 | 83 | 281 |
| 2025 | 522 | 261 | 50.0% | 169 | 92 | 257 |
The year-to-year range is 8.2 percentage points. That is meaningful enough to see, but it does not support a claim that UFC fights are becoming steadily more or less likely to finish. A change in matchmaking, weight-class mix, athlete pool, cancellations, or ordinary variance can move a single year’s rate.
The longer historical comparison is more dramatic. From 1994 through 2004, 74.0% of 419 bouts finished. The rate was 54.8% across 2,608 bouts from 2005 through 2014 and 49.0% across 5,448 bouts from 2015 through 2025.
That does not mean modern fighters are simply less aggressive. Early UFC events differed in rules, tournament format, competitive depth, weight matching and roster composition. The era numbers describe the record; they do not isolate a single cause.
Which UFC weight class has the highest finish rate?
Heavyweight has the highest all-time finish rate among divisions with at least 100 recorded bouts: 506 finishes in 765 fights, or 66.1%. Light heavyweight ranks second at 61.3%, followed by middleweight at 59.0%.
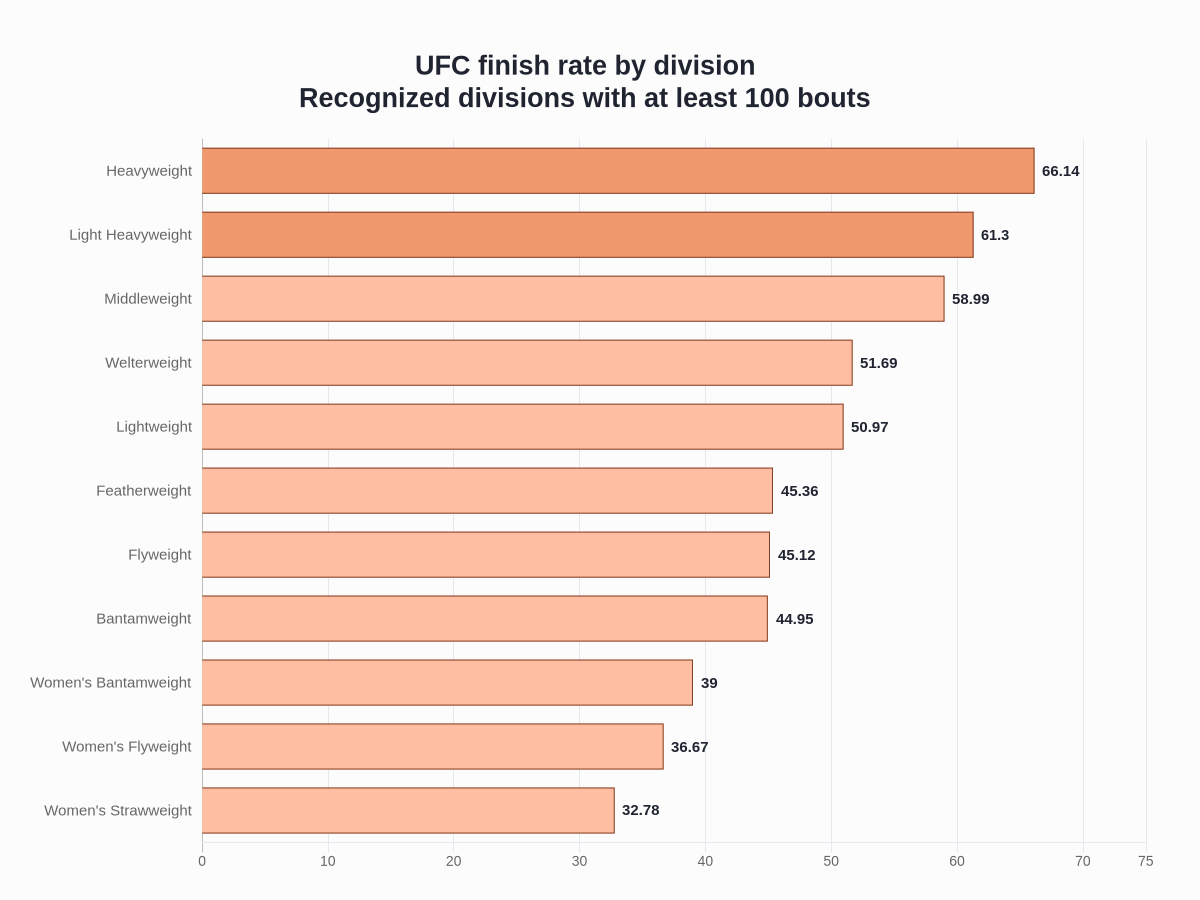
| Division | Fights | Finishes | Finish rate | KO/TKO | Submissions |
|---|---|---|---|---|---|
| Heavyweight | 765 | 506 | 66.1% | 394 | 112 |
| Light Heavyweight | 752 | 461 | 61.3% | 332 | 129 |
| Middleweight | 1,134 | 669 | 59.0% | 432 | 237 |
| Welterweight | 1,387 | 717 | 51.7% | 458 | 259 |
| Lightweight | 1,436 | 732 | 51.0% | 423 | 309 |
| Featherweight | 851 | 386 | 45.4% | 245 | 141 |
| Flyweight | 410 | 185 | 45.1% | 97 | 88 |
| Bantamweight | 772 | 347 | 45.0% | 197 | 150 |
| Women's Bantamweight | 241 | 94 | 39.0% | 53 | 41 |
| Women's Flyweight | 270 | 99 | 36.7% | 46 | 53 |
| Women's Strawweight | 363 | 119 | 32.8% | 49 | 70 |
Women’s strawweight has the lowest rate in the qualifying group at 32.8%. Women’s flyweight is next at 36.7%, followed by women’s bantamweight at 39.0%. Men’s bantamweight, flyweight and featherweight cluster closely between 44.9% and 45.4%.
The chart folds title fights, interim-title fights and tournament finals into their recognized weight class. Catchweight, open-weight, superfight and women’s featherweight categories are excluded from the chart because they either do not map cleanly to a current division or fall below the 100-bout threshold.
These are raw historical rates. Divisions entered the UFC in different years and therefore faced different eras, rosters and rules environments. The table is useful for description, not for claiming that weight alone causes the difference.
Do UFC title fights finish more often?
Official UFC championship and interim-title fights have a higher full-bout finish rate, but the difference is explained by the extra scheduled rounds. In this dataset, 225 of 392 title bouts finished, a rate of 57.4%. Non-title bouts finished at 51.6%.
That first comparison is not apples to apples. Most title fights can run for 25 minutes, while most non-title fights are scheduled for 15. When both groups are limited to finishes occurring within the first 15 minutes, the title-bout rate falls to 46.7%. The non-title rate is 51.1%.
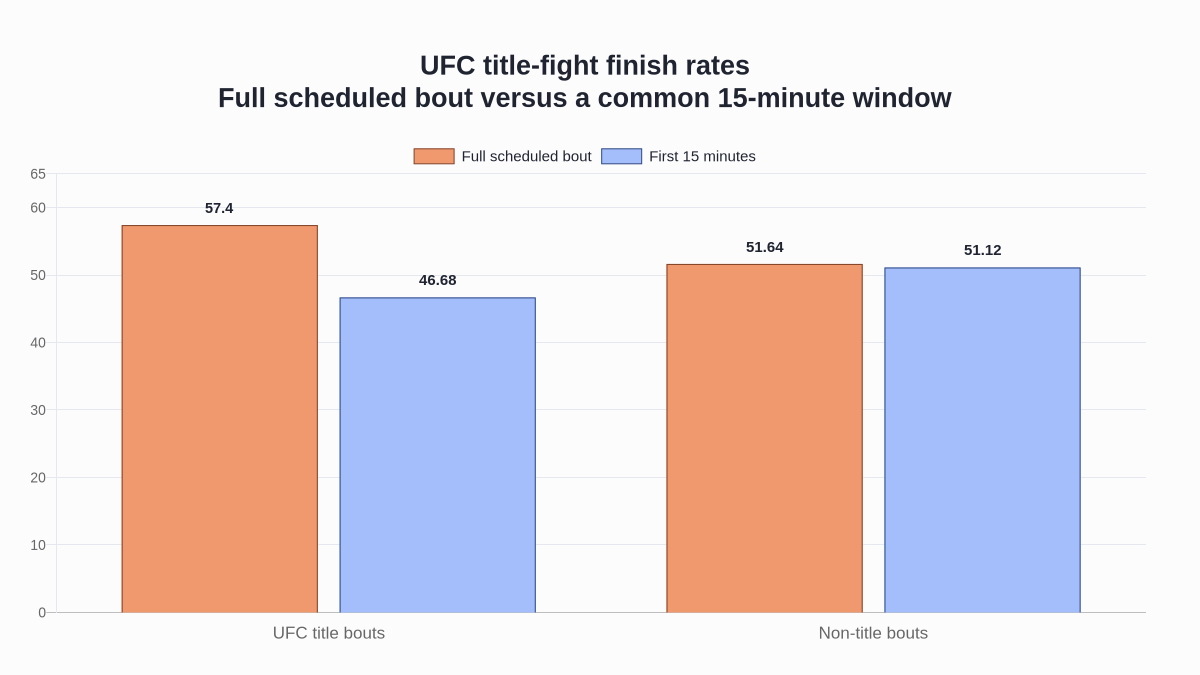
| Group | Fights | Full-bout finishes | Full-bout rate | Finishes by 15:00 | 15-minute rate |
|---|---|---|---|---|---|
| Official title bouts | 392 | 225 | 57.4% | 183 | 46.7% |
| Non-title bouts | 8,199 | 4,234 | 51.6% | 4,191 | 51.1% |
Forty-two title-fight finishes occurred after the 15-minute mark. Those additional opportunities turn a lower early finish rate into a higher final rate. This does not prove that championship fighters pace themselves, nor does it measure fighter quality. It shows why scheduled duration must be considered before interpreting the headline.
What is the average UFC fight length?
The average fight in this dataset lasted 10 minutes 37 seconds. The median was 13 minutes 48 seconds, meaning half of recorded bouts ended before that point and half lasted longer.
The median is longer than the mean because thousands of early finishes pull the average downward. There were 2,349 first-round finishes, representing 52.7% of all finishes and 27.3% of every fight analyzed.
Elapsed time was calculated from the recorded ending round, the clock time within that round and the scheduled round lengths. This matters for early UFC formats, which included longer opening rounds, overtime periods and no-time-limit bouts. Applying a modern five-minute-round formula to every historical fight would produce incorrect durations.
How was this UFC fight dataset analyzed?
For another GrapplerHQ study built the same way, from primary documents rather than secondary reporting, see our analysis of how much UFC referees make, which compiles published athletic commission pay scales alongside 448 referee assignments taken from Nevada commission records.
- We used the MIT-licensed UFC-DataLab bout file, which identifies UFCStats and official UFC scorecards as upstream sources.
- Each row was treated as one bout. We checked required dates, methods and outcomes and tested a composite bout key for duplicates.
- KO/TKO includes doctor stoppages. Submission remains separate. Unanimous, split and majority results are grouped as decisions.
- Elapsed time uses the round lengths supplied in each row’s time-format field rather than assuming every bout used the modern format.
- Division names were normalized so title bouts and tournament finals joined the corresponding weight class. Divisions needed at least 100 bouts for the comparison chart.
- Official title bouts include UFC championship and interim-title fights but exclude tournament finals. The first-15-minute comparison prevents extra championship rounds from distorting the like-for-like view.
The final file contains 8,591 rows and 74 original fields, covering March 11, 1994 through March 28, 2026. Required outcome and timing fields were complete, and every aggregate shown in this article reconciles to the bout total.
View the source dataset and repository
What are the limitations of this study?
- Snapshot date: UFC events after March 28, 2026 are not included.
- Secondary compilation: The analyzed CSV is an independent, open-source compilation derived from UFCStats and official scorecards, not a file published by the UFC.
- Descriptive analysis: Differences by division, era or title status do not establish why those differences exist.
- Historical comparability: UFC formats, rules, rosters and weight classes changed substantially across the 32-year period.
- Result categories: “Other” combines several rare outcomes to keep the main comparison readable.
Corrections: If the upstream record changes or a transformation error is identified, GrapplerHQ will update the affected aggregate and note the correction on this page.
Frequently asked questions
What percentage of UFC fights end in a finish?
Across 8,591 fights, 51.9% ended by KO/TKO or submission. KO/TKO accounted for 32.6% and submissions for 19.3%.
What percentage of UFC fights go to a decision?
Decisions accounted for 46.8% of the dataset: 4,016 of 8,591 fights. Of those decisions, 3,098 were unanimous, 818 were split and 100 were majority decisions.
Which UFC division has the most finishes?
Heavyweight has the highest finish rate among divisions with at least 100 bouts: 66.1%. Lightweight has the largest raw finish count in the division table, with 732 finishes across 1,436 fights.
How long is the average UFC fight?
The average recorded duration was 10:37, while the median was 13:48. The calculation accounts for historical round formats rather than assuming every fight used three five-minute rounds.
Are UFC title fights more likely to finish?
They are more likely to finish across the full scheduled bout: 57.4% versus 51.6% for non-title fights. Within the first 15 minutes, however, title bouts finished less often: 46.7% versus 51.1%.
How should this research be cited?
Suggested citation: “UFC Statistics: Finish Rates & Fight Trends, 1994–2026 (8,591 Bouts),” GrapplerHQ, dataset through March 28, 2026. Please link to this page so readers can review the methods, limitations and latest update.
For a grappling-specific companion study, see GrapplerHQ’s UFC BJJ statistics. For how fights that reach the cards are evaluated, read our guide to UFC scoring.
Last updated July 3, 2026.
A large share of the UFC’s grappling talent comes through combat sambo, the Russian rule set that combines throws, strikes and chokes in one competition format — the background behind Fedor Emelianenko, Khabib Nurmagomedov and Islam Makhachev.